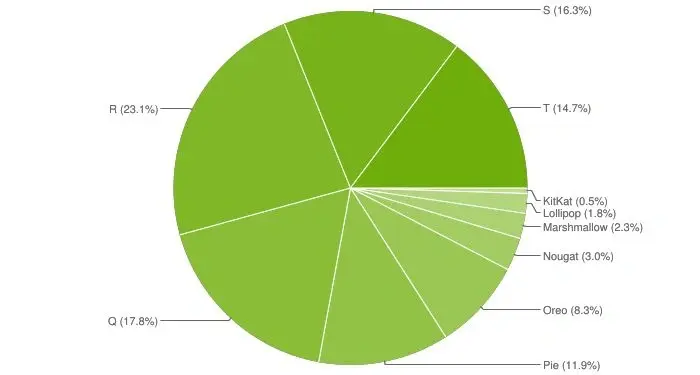
Google has recently released a pie chart showing the adoption rate of Android, the system used by most mobile phone brands in the world. According to the official pie chart data released by Google, the Android 13 system accounts for about 15%. The chart also reveals that Android 11 which was released three years ago still accounts for the largest share. By accessing Google Play’s device data, Google regularly produces and publishes Android version pie chart data.

According to the pie chart released by Google, the adoption rate of Android 10 is currently at 17.8% and it is the second largest. This means that out of all the Android devices in the market, only a few of them are running on the latest version of the operating system. The rate of Android 10 adoption is higher than that of Android 12 which was only 10% during the same period last year.
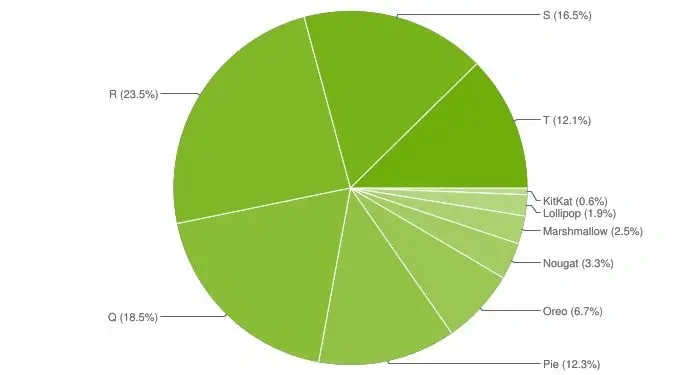
Android Studio updated a chart as of May 30, 2023, revealing the following
- Android 13 system increased from 12.1% (April data) to 14.7% (June data)
- Android 12, Android 11 and Android 10 systems have declined slightly. However, Android 11 still occupies the top transaction, accounting for 23.1%.
- Android 8.0 Oreo increased from 6.7% (April data) to 8.3% (June data)

Challenges in Android Adoption
One of the biggest challenges that Google faces in terms of Android adoption is fragmentation. Unlike Apple’s iOS, which is only available on a limited number of devices, Android is used by a wide range of manufacturers and devices. This makes it difficult for Google to ensure that all devices are running on the latest version of the operating system.
Another challenge is the slow rollout of updates by device manufacturers. While Google releases updates to its operating system regularly, it is up to the device manufacturers to push these updates to their devices. This means that some devices may not receive updates for months or even years after they are released.
Google’s Android distribution chart is intended for Android developers, and it is updated roughly every six months to a year. The chart shows what percentage of devices are on a particular version or newer. However, historically, Google freely offered this information on the web in the form of a frequently updated pie chart, assigning a percentage to each version of Android.
More recently, Google has taken a new tack with the Android distribution chart, putting the info into Android Studio in a way that shows what percentage of devices are on a particular version or newer. According to Statista, the lack of Android 12 statistics in the chart, as of January 6, 2023, is likely related to its intended purpose for Android developers. However, the Android 12 stats is now available in the latest Android pie chart released in June 2023.
Android 13 Features
Despite these challenges, Android 13 comes with a number of new features and improvements that make it a worthwhile upgrade for Android users. Some of the most notable features include:
- Auto-theming icons
- More Material You theming options
- Alternative lock screen clock setup
- Native Bluetooth LE Audio support
- Improved support for tablets and large-screen devices
In addition to these features, Android 13 also comes with a number of privacy and security updates that make the operating system more secure and private.
Conclusion
The adoption rate of Android 13 is currently at 15%. This is a significant improvement compared to the adoption rate of Android 12 during the same period last year. However, Google still faces challenges in terms of Android adoption. This is mainly due to fragmentation and slow rollout of updates by device manufacturers. Despite these challenges, Android 13 comes with a number of new features and improvements. These make it a worthwhile upgrade for Android users. No doubt, more users will likely upgrade to Android 13 as the years roll on.


